 Donaldson R F
Demo account · information only
DRF Signals: Metals pairs
The Metals pairs signal follows the orders on XAUUSD and XAGUSD from my master account, copied to its own demo account. It is a demo account, so no real money is at stake in it, and nothing on this page is advice.
Market take
Live data is connecting
A short written read of these markets, refreshed about every three hours, covering XAUUSD and XAGUSD: the US dollar, real yields, central bank buying, geopolitical stress, safe-haven demand and the economic calendar.
The take is written with the help of an automated tool. It is a general outlook, not a recommendation.
Heat map: 2 instruments by timeframe
Rows are the instruments, columns the nine timeframes from one minute (M1) to one month (MN). The colour runs from strong sell to strong buy and summarises trend, RSI, MACD and moving averages. A short note under each instrument says what the readings add up to. It is a reading of what the indicators say now, not a forecast.
Live data is connecting
The demo account
IC Markets demo, account type Standard, leverage 1:500, started with 1,000 EUR. It receives the orders of my master account for this group. Figures are shown in euro.
Live data is connecting
Live orders and charts
Live data is connecting
Live data is connecting
How to copy this signal
- Subscribe to the DRF Key. The first 7 days are free, a card is required at checkout, and you pay nothing if you cancel during the trial.
- Install the DRF Signal Copier on MetaTrader 5, one Expert Advisor for each signal you follow. Test it on a demo account first.
- Allow the sync address in the WebRequest list, enter your key, and choose how the lot size scales to your account.
Signal Expert Advisor for this group: not available yet. Use the DRF Signal Copier for now; this page will say when a version for Metals pairs is ready.
Instruments in this signal (2)
- XAUUSD
- XAGUSD
Frequently asked questions
- Why do XAUUSD and XAGUSD sit in one signal?
- They tend to react to the same forces: the US dollar, interest rate expectations and risk appetite. They do not always move together, so the page shows each of them and the relation between them.
- What is the XAUUSD to XAGUSD relation?
- The price of XAUUSD divided by the price of XAGUSD: how many units of silver one unit of gold is worth. A high or low reading says how the two metals compare right now. It is information, not a signal to trade.
- Is XAUUSD the instrument you trade most?
- It is the instrument I know best, which is why the live tools on this site are about XAUUSD. The Metals pairs demo account receives only the orders on XAUUSD and XAGUSD.
- How wide can XAUUSD and XAGUSD move in a day?
- Both can move a lot in minutes around news such as US inflation data or central bank decisions. Wide spreads and gaps are normal at those times, and a stop loss can be filled at a worse price than you set.
- What is a demo signal?
- A signal that comes from a demo account: an account with virtual money at the broker. It follows the orders I place on my master account, so it behaves like a live account, but nobody risks real money in it. I am not an authorised financial adviser, which is why I prefer demo accounts that mirror what I do on my real IC Markets account.
- How do I read the heat map?
- Each row is an instrument and each column a timeframe, from one minute (M1) to one month (MN). The colour goes from strong sell to strong buy and summarises trend, RSI, MACD and moving averages. It is a reading of what the indicators say now, not a forecast and not advice.
- Can I copy this signal?
- Yes, with a DRF Key. The key gives access to the DRF Signal Copier, which mirrors the orders of a signal on your own MetaTrader 5 account. Use one Expert Advisor for each signal you want to follow. Test on a demo account first.
- Is there a free trial?
- Every new DRF Key starts with a free trial of 7 days. A card is required at checkout; if you cancel during the trial you pay nothing.
- Will I get the same results as the demo account?
- No promise of that can be made. Your broker, spread, delay, account size and settings are different, and the demo account is not subject to the same conditions as a real one. Results vary and the way I trade can lose.
- Why does the page sometimes say the data is connecting?
- Because the figures only appear when the demo account has sent them. When there is nothing to show, the page says so instead of inventing a number.
Articles about these markets

XAUUSD Market Analysis
Market Analysis #43: Gold Steadies Near $4,120 | 8 Oct 2026
Gold rebounds from a nine-week low near $4,066 as the dollar eases off its 18-month high, with US jobless claims and Fed speakers due later on 8 October.
8 October 2026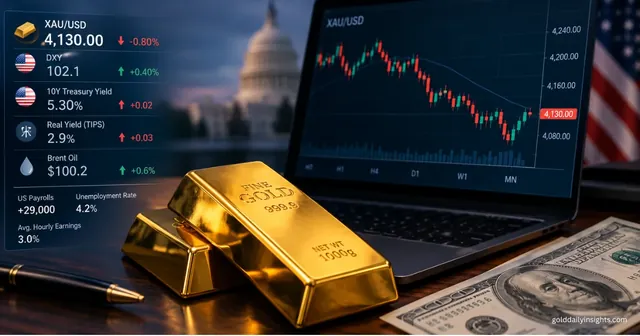
XAUUSD Market Analysis
Market Analysis #42: Gold Tests $4,130 | 7 Oct 2026
Gold slips toward $4,130 as the dollar firms and yields hold near five-year highs ahead of today's FOMC minutes. I break down the key levels and scenarios for…
7 October 2026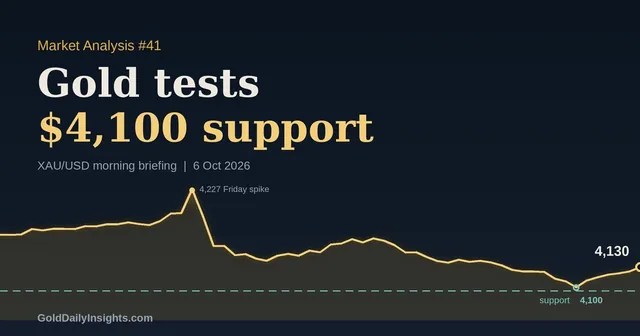
XAUUSD Market Analysis
Market Analysis #41: Gold Tests $4,100 Support | 6 Oct 2026
Gold is hovering near $4,130 after tagging a two-month low at $4,103. I break down yields, the dollar, today's Fed speakers and the key levels for 6 October.
6 October 2026
XAUUSD Market Analysis
Market Analysis #40: Gold Holds $4,100 Ahead of ISM | 5 Oct 2026
Gold holds above $4,100 as yields and the dollar cap the rally. My 5 October read on key levels, the ISM Services PMI and the scenarios I am watching today.
5 October 2026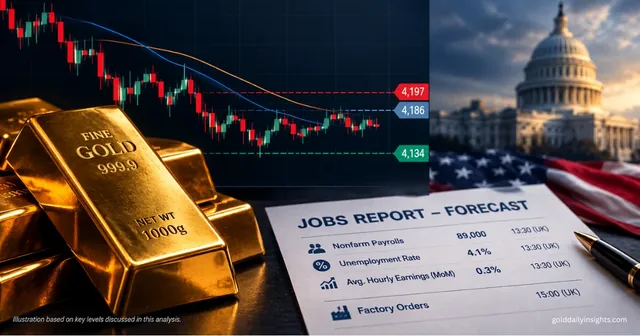
XAUUSD Market Analysis
Market Analysis #39: Gold Holds $4,180 Ahead of NFP | 2 Oct 2026
Gold sits near $4,180 as the dollar and 10-year yield stay firm. My key levels, scenarios and what to watch before today's US jobs data on Friday 2 October.
2 October 2026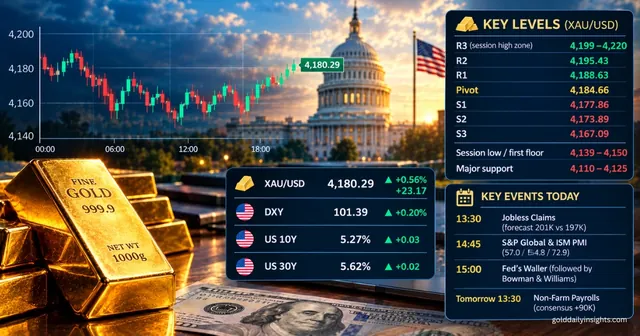
XAUUSD Market Analysis
Gold Analysis #38: Rebound Holds Above $4,180 | 1 Oct
Gold claws back above $4,180 on 1 October as the dollar stays firm and Treasury yields near multi-year highs cap the bounce. Levels, Fed outlook and today's…
1 October 2026Verify the results
The Myfxbook profile shows the results of the demo accounts independently of this site. These are my public profiles, not affiliate links.
Brokers and hosting I use
I recommend only what I use. I have been a client of IC Markets, IC Trading, FTMO and IONOS for many years.
- IC Markets is the broker of the DRF Signal account, and the broker I use myself.
- IC Trading is my suggestion if you live in Brazil or Europe.
- FTMO is my suggestion if you want a prop firm, anywhere in the world. I use an FTMO Classic account (FTMO Swing), because it leaves me full freedom.
- IONOS is the hosting company. The whole system runs on a Windows Server 2025 VPS at IONOS in New York, close to the broker.
These are affiliate links. If you open an account or buy through them I may be paid a commission, at no extra cost to you. Read the Affiliate Disclosure and the full page. Trading carries a high level of risk; check that a company is authorised in your country before you use it.
Disclosure
This signal comes from a demo account. It is not a real account, it is not investment advice and it is not a recommendation to buy or sell anything. I am not an authorised financial adviser. Past results do not predict future results. See the Risk Disclosure and the Affiliate Disclosure.